<!--#include file="diagram.asp"-->
<HTML><HEAD></HEAD>
<BODY bgcolor="#eeeeee">
<%
'1st diagram
Set D1=New Diagram
Set D1.Img=CreateObject("gdImage.Images.1")
D1.Img.ImageCreate 640, 280
D1.Img.ImageColorAllocate 0,255,255,255 'Background Color
D1.SetFrame 60, 20, 470, 240
D1.SetBorder UTC(2001,12,1,8,0,0), UTC(2001,12,1,17,0,0), UTC(2003,1,1,0,0,0), UTC(2001,12,1,0,0,0)
D1.XScale=2
D1.YScale=2
D1.SetText "","", "Our Call Service 2002"
D1.Font=2
D1.Draw "#C0C080", "#004080", false,"Click on a bar to get the phone number", ""
Name=Array("Peter", "Paul", "Mike")
Job=Array("Project Manager", "Assistant", "Developer")
Color=Array("#FF0000" ,"#00FF00" ,"#0000FF")
BGColor=Array("#000000" ,"#000000" ,"#FFFFFF")
Phone=Array("000-11-23", "123-45-67", "333-66-99")
D1.BFont=3
for i=0 to 11
D1.Bar _
D1.ScreenX(UTC(2001,12,1,8+Int(rnd()*4),30*Int(rnd()*2),0)), _
D1.ScreenY(UTC(2002,i+1,1,0,0,0))-8, _
D1.ScreenX(UTC(2001,12,1,13+Int(rnd()*4),30*Int(rnd()*2),0)), _
D1.ScreenY(UTC(2002,i+1,1,0,0,0))+8, _
Color(i Mod 3), Name(i Mod 3), BGColor(i Mod 3), Job(i Mod 3), "ShowPhoneNum("& CStr(i Mod 3) & ")"
next
D1.BFont=5
D1.Arrow 550,75,515,145,Color(0),2,"",""
D1.Arrow 515,175,585,225,"#000000",1,"",""
D1.Arrow 560,75,600,225,Color(2),3,"",""
D1.Box 520, 50, 590, 70, Color(0), Name(0), BGColor(0), 2, "#000000", Job(0), "ShowPhoneNum(0)"
D1.Box 480, 150, 550, 170, Color(1), Name(1), BGColor(1), 2, "#000000", Job(1), "ShowPhoneNum(1)"
D1.Box 560, 230, 630, 250, Color(2), Name(2), BGColor(2), 2, "#000000", Job(2), "ShowPhoneNum(2)"
FN="static_example1.png"
if isObject(Server) then FN=Server.mappath(FN)
D1.Img.ImagePng 0, FN
D1.Img.ImageDestroy 0
Set D1.Img=Nothing
%>
<table border><tr><td><IMG src="static_example1.png" width=640 height=280 usemap="#map1" border=0></td></tr></table>
<map name="map1">
<%Response.Write D1.ImgMapData%>
</map>
<script language="JavaScript">
Name=new Array("Peter", "Paul", "Mike");
Phone=new Array("000-11-23", "123-45-67", "333-66-99");
function ShowPhoneNum(ii){ alert("Dial "+Phone[ii]+" to speak with "+Name[ii]+"."); }
</script>
<%
'2nd diagram
Set D2=New Diagram
Set D2.Img=CreateObject("gdImage.Images.1")
D2.Img.ImageCreate 640, 280
D2.Img.ImageColorAllocate 0,255,255,255 'Background Color
D2.SetFrame 60, 30, 470, 240
D2.SetBorder UTC(2001,12,1,0,0,0), UTC(2001,12,17,0,0,0), 0, 80
D2.XScale=2
D2.YScale=" $"
D2.SetText "","", "prices of some selected goods"
D2.SetGridColor "#DDDDFF", ""
D2.Draw "#C0C0FF", "#004080", false, "", ""
Color=Array("#FF0000","#FF8000","#FFFF00")
Dim Price()
ReDim Price(2,16)
for i=0 to 2
Price(i,0)=50-20*i+Int(rnd()*5)
D2.Dot D2.ScreenX(UTC(2001,12,1,0,0,0)), D2.ScreenY(Price(i,0)), 12, i, Color(i), CStr(Price(i,0)) & " $", ""
for j=1 to 16
Price(i,j)=Price(i,j-1)+Int(rnd()*11)-4+2*i-Int(rnd()*(2*i+3))
D2.Dot D2.ScreenX(UTC(2001,12,j+1,0,0,0)), D2.ScreenY(Price(i,j)), 12, i, Color(i), CStr(Price(i,j)) & " $", ""
next
next
D2.Bar 490, 50, 570, 70, Color(0), "apples", "#000000", "", ""
D2.Bar 490, 90, 570, 110, Color(1), "oranges", "#000000", "", ""
D2.Bar 490, 130, 570, 150, Color(2), "bananas", "#000000", "", ""
FN="static_example2.png"
if isObject(Server) then FN=Server.mappath(FN)
D2.Img.ImagePng 0, FN
D2.Img.ImageDestroy 0
Set D2.Img=Nothing
%>
<table border><tr><td><IMG src="static_example2.png" width=640 height=280 usemap="#map2" border=0></td></tr></table>
<map name="map2">
<%Response.Write D2.ImgMapData%>
</map>
<%
'3rd diagram
nInterval=21
Dim PriceCount
ReDim PriceCount(2,nInterval-1)
for i=0 to 2
for j=0 to nInterval-1
PriceCount(i,j)=0
next
next
xmin=Price(0,0)
xmax=Price(0,0)
for i=0 to 2
for j=0 to 16
if xmin > Price(i,j) then xmin=Price(i,j)
if xmax < Price(i,j) then xmax=Price(i,j)
next
next
i=xmax-xmin
xmin=xmin-i/10
xmax=xmax+i/10
Set D3=New Diagram
Set D3.Img=CreateObject("gdImage.Images.1")
D3.Img.ImageCreate 640, 280
D3.Img.ImageColorAllocate 0,255,255,255 'Background Color
D3.SetFrame 60, 30, 470, 240
D3.SetBorder xmin, xmax, 0, 1
D3.XScale=" $"
D3.GetXGrid
for i=0 to 2
for j=0 to 16
k=GetInterval(D3.XGrid(0),D3.XGrid(1),D3.XGrid(2),Price(i,j))
PriceCount(i,k)=PriceCount(i,k)+1
next
next
ymin=0
ymax=0
for i=0 to nInterval-1
if ymax < PriceCount(0,i)+PriceCount(1,i)+PriceCount(2,i) then _
ymax=PriceCount(0,i)+PriceCount(1,i)+PriceCount(2,i)
next
ymax=ymax+ymax/10
D3.SetBorder xmin, xmax, ymin, ymax
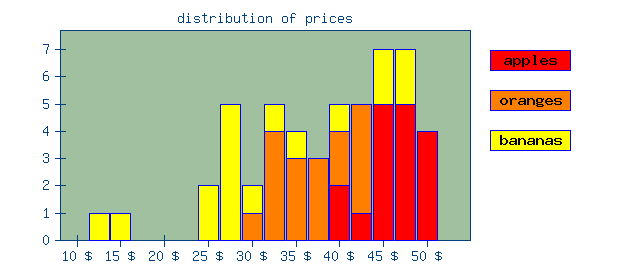
D3.SetText "","", "distribution of prices"
D3.Draw "#A0C0A0", "#004080", false, "", ""
for j=0 to nInterval-1
i=D3.ScreenX(D3.XGrid(0)+j*D3.XGrid(1)/2)
ymin=D3.ScreenY(0)
ymax=D3.ScreenY(PriceCount(0,j))
if PriceCount(0,j) > 0 then _
D3.Box i-10,ymax,i+10,ymin,Color(0),"","#000000",1,"#0000ff",CStr(PriceCount(0,j)) & " days", ""
ymin=ymax
ymax=D3.ScreenY(PriceCount(0,j)+PriceCount(1,j))
if PriceCount(1,j) > 0 then _
D3.Box i-10,ymax,i+10,ymin,Color(1),"","#000000",1,"#0000ff",CStr(PriceCount(1,j)) & " days", ""
ymin=ymax
ymax=D3.ScreenY(PriceCount(0,j)+PriceCount(1,j)+PriceCount(2,j))
if PriceCount(2,j) > 0 then _
D3.Box i-10,ymax,i+10,ymin,Color(2),"","#000000",1,"#0000ff",CStr(PriceCount(2,j)) & " days", ""
next
D3.Box 490, 50, 570, 70, Color(0), "apples", "#000000", 1, "#0000ff", "", ""
D3.Box 490, 90, 570, 110, Color(1), "oranges", "#000000", 1, "#0000ff", "", ""
D3.Box 490, 130, 570, 150, Color(2), "bananas", "#000000", 1, "#0000ff", "", ""
function GetInterval(mmin,ddelta,mmax,vvalue)
nn=0
for ii=mmin to mmax-ddelta/2 step ddelta/2
if vvalue < ii+ddelta/4 then
GetInterval=nn
exit function
end if
nn=nn+1
next
GetInterval=nn
end function
FN="static_example3.png"
if isObject(Server) then FN=Server.mappath(FN)
D3.Img.ImagePng 0, FN
D3.Img.ImageDestroy 0
Set D3.Img=Nothing
%>
<table border><tr><td><IMG src="static_example3.png" width=640 height=280 usemap="#map3" border=0></td></tr></table>
<map name="map3">
<%Response.Write D3.ImgMapData%>
</map>
</BODY>
</HTML> |