<!--#include file="diagram.asp"-->
<%
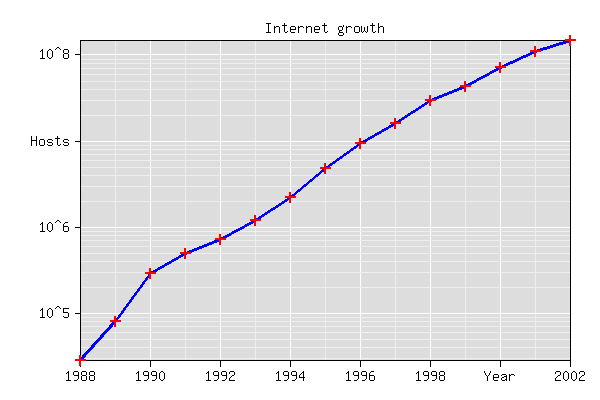
Hosts=Array(28174, 80000, 290000, 500000, 727000, 1200000, 2217000, 4852000, 9472000, 16146000, 29670000, 43230000, 72398092, 109574429, 147344723)
Log10=Log(10)
Function LogScale(vv)
if ((vv > 3) or (vv < -3)) then
LogScale="10^" & vv
else
if (vv > =0) then
LogScale=Round(Exp(vv*Log10))
else
LogScale=1/Round(Exp(-vv*Log10))
end if
end if
end Function
Set D=New Diagram
Set D.Img=CreateObject("gdImage.Images.1")
D.Img.ImageCreate 600, 400
D.Img.ImageColorAllocate 0,255,255,255 'Background Color
D.SetFrame 80, 40, 570, 360
D.SetBorder 1988, 2002, Log(Hosts(0))/Log10, Log(Hosts(14))/Log10
D.SetText "Year", "Hosts", "Internet growth"
D.XGridDelta=2
D.XSubGrids=2
D.YGridDelta=1
D.YSubGrids=-1
D.YScale="function LogScale"
D.SetGridColor "#FFFFFF", "#EEEEEE"
D.Draw "#DDDDDD", "#000000", true, "", ""
for n=1 to UBound(Hosts)
D.Line D.ScreenX(1987+n), D.ScreenY(Log(Hosts(n-1))/Log10), D.ScreenX(1988+n), D.ScreenY(Log(Hosts(n))/Log10), "#0000ff", 2, "internet hosts", ""
next
for n=0 to UBound(Hosts)
D.Dot D.ScreenX(1988+n), D.ScreenY(Log(Hosts(n))/Log10), 10, 1, "#ff0000", CStr(1988+n) & ": " & Hosts(n) & " hosts", ""
next
FN="logarithmic_scale.png"
if isObject(Server) then FN=Server.mappath(FN)
D.Img.ImagePng 0, FN
D.Img.ImageDestroy 0
Set D.Img=Nothing
%>
<HTML><HEAD></HEAD>
<BODY bgcolor="#eeeeee">
<table border><tr><td><IMG src="logarithmic_scale.png" width=610 height=500 usemap="#map1" border=0></td></tr></table>
<map name="map1">
<%Response.Write D.ImgMapData%>
</map>
</BODY>
</HTML> |